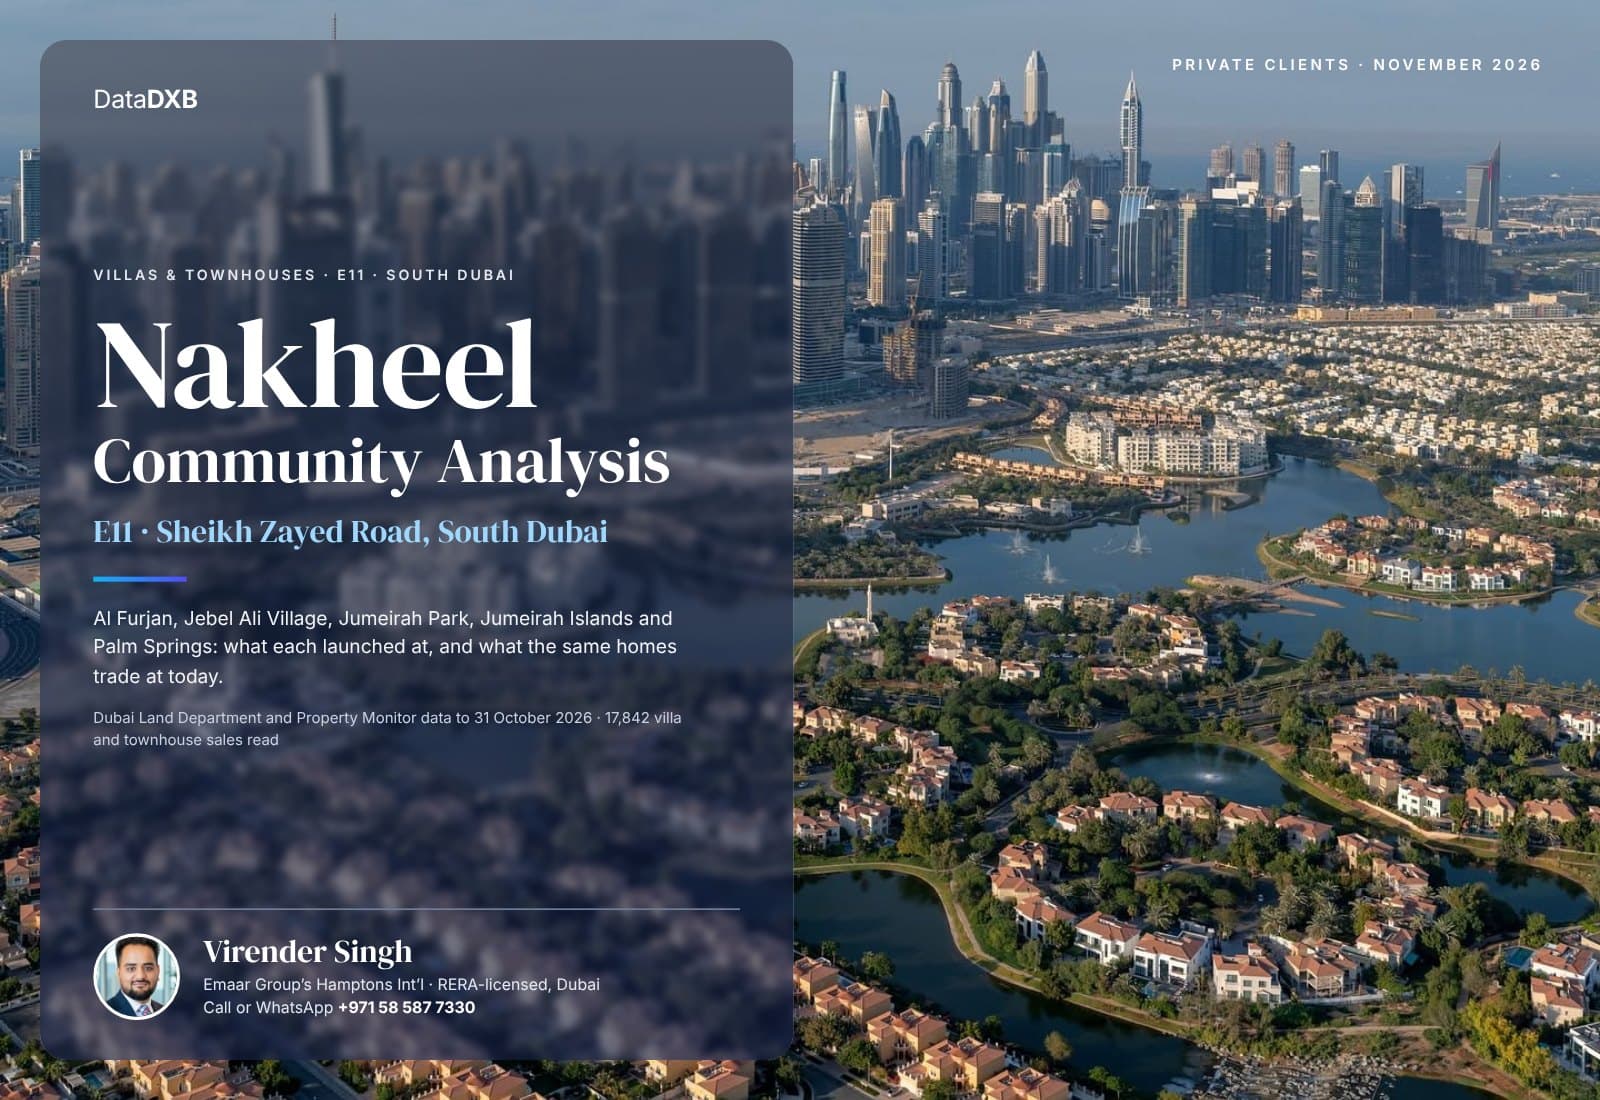
Investor report · Nakheel on the E11 (Sheikh Zayed Road)November 2026
Nakheel Community Analysis: E11 Villas and Townhouses
Launch price vs today for Nakheel's E11 villas and townhouses: Al Furjan, Jebel Ali Village, Jumeirah Park and Jumeirah Islands, plus Palm Springs.
2026 edition · 24 pages · PDF 760 KB
Free with a DataDXB account.
At a glance
1.77–2.34x
launch price, same homes
Every Nakheel launch on the E11 since 2021, Nov 2025 – Oct 2026
16 of 17
comparisons won
Same homes against Wasl's Gardenia Townhomes and Danube's Dreamz in the same areas
AED 514 → 4,239
per sq ft, Jumeirah Islands
Original contracts (2004 island villas, the Mansions and the 2013 Townhouses) to Nov 2025 – Oct 2026
212
villas due in 12 months
And 0 townhouses on this stretch of the E11; 197 of the villas are Nakheel's, on Palm Jebel Ali
What the data says
Key findings
01
Every launch since 2021 trades at 1.77 to 2.34 times its launch price.
Same homes, AED per sq ft of built-up area, launch window to Nov 2025 – Oct 2026: Murooj Al Furjan 1,005 to 2,174 (+134.2%), Murooj Al Furjan West 891 to 2,028 (+124.3%), Tilal Al Furjan 943 to 1,761 (+87.3%) and Jebel Ali Village 988 to 1,792 (+76.7%). That is 14.9% to 20.6% a year since launch.
02
Nakheel rose more in 16 of 17 like-for-like comparisons.
Same homes over fixed windows from 2014, Q4 2019, Q1 2020, 2020 and 2021 to today, against Wasl's Gardenia Townhomes and Danube's Dreamz. The one exception: from Q4 2019, Al Furjan Villas rose 142.6% against Gardenia's 154.5%, on a thin base. Separately, on Property Monitor's layout measure, Al Furjan's owner-built private villas rose 243.6% since 2021 against 105.0% for Al Furjan Villas.
03
Bought at the original price, today's rents pay 5.8% to 40.1% gross.
New-lease rents against original prices: Jumeirah Islands 4-bed 31.7% (median original contract AED 2.05m, AED 20.50m today), Murooj Al Furjan 3-bed 13.4%, Jumeirah Park 3-bed 11.8%. On today's prices, these Nakheel homes yield 3.2% to 5.4% gross, before service charges.
What's inside
Contents
- p. 2
Key findings
Each Nakheel launch since 2021, launch price against today's, same homes.
- p. 3
Nakheel on the E11 at a glance
Eight communities launched 2004 to 2022: launch date, handover, homes, layouts, and AED per sq ft at launch and now.
- p. 4
Community profiles
Al Furjan Villas, Murooj Al Furjan, Murooj Al Furjan West, Tilal Al Furjan, Jebel Ali Village, Royal Park, Jumeirah Park and Jumeirah Islands: built-up area, plot, homes traded, price per sq ft, median price and gross yield for every layout.
- p. 12
Price trajectory
Same homes indexed to launch, year by year for the 2018–22 launches and at fixed points for Jumeirah Islands, Jumeirah Park and Al Furjan Villas, and AED per sq ft at launch against now.
- p. 14
Sales volumes
Villa and townhouse sales per year in each Nakheel community, 2006 to 2026.
- p. 15
Resale market
Price change from launch to today's resales, Nakheel against Wasl's Gardenia Townhomes I and II and Sunrise Living.
- p. 16
Returns over fixed windows
Same-homes price change from 2008, 2014, Q4 2019, Q1 2020 and 2021 to today.
- p. 17
Against other developers
17 same-homes comparisons with Wasl and Danube, plus BNH and Al Furjan's private villas.
- p. 18
Rental yields
Gross yield on today's price and on the original price, by community and bedroom count, from DLD Ejari new leases.
- p. 19
What the track record shows
7,374 homes, five launches since 2018 completed, every one above its launch price per sq ft.
- p. 20
Palm Springs
Nakheel's new masterplan near Palm Jebel Ali: what the average path of its last five E11 launches would mean from an expected AED 1,800 per sq ft. An illustration, not a forecast.
- p. 21
Upcoming supply
Villas, townhouses and apartments due on this stretch of the E11 in the next 6, 8 and 12 months, project by project.
- p. 22
Method & sources
How every number is built: DLD sales, Property Monitor, the same-homes model, launch prices, price per sq ft and yields.
Get the full 24-page report
Every community, layout, launch and resale price, rent and yield, plus the Palm Springs illustration, with sources. Sign in to download.
The author is a RERA-licensed broker at Emaar Group's Hamptons Int'l and may act on transactions in the areas discussed. DataDXB is a personal project; all views and analysis are the author's own and do not represent the author's employer. Prices are registered DLD sales and Property Monitor records and are indicative; this report is not a valuation, and the Palm Springs path is an illustration from past launches, not a forecast. General market research, not personalised advice. For advice on your own situation, get in touch. How we work.